Target Market Analysis with the help of LLMs
This blog post provides a comprehensive guide on how to perform target market analysis for your company using LLMs. It includes a detailed explanation of the BCG Matrix and the GE McKinsey Matrix, and how these frameworks can be used to determine market attractiveness and competitive advantage.
The open source code is available here.
After working on OpenBB for over 2 years, we learned which markets to go after and which markets to ignore. You may think that this is intuition, but it’s actually the data that you gathered from talking with 100+ users and learning from others in the industry.
However, people who don’t know your business as well as you do (new joiners, advisors, or investors), don’t understand why your target market is X and not Y. Hence, it’s important to backtrace your “experience” with data.
This blog post will focus on how you can perform target market analysis for your company. I will provide the framework and the code to leverage OpenAI to speed up that research process. All of this will be replicable, and you can do it for your own company.
Context
This framework is utilized for portfolio analysis in corporate strategy to analyze business units or product lines.
BCG Matrix
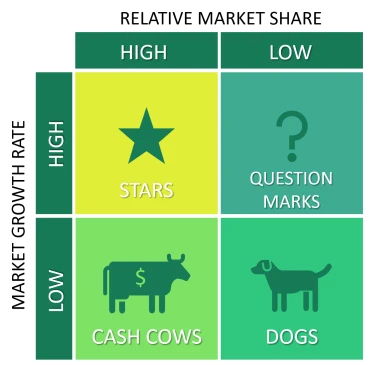
Initially, BCG implemented its own framework, which you can read more about here. In a nutshell:
It uses two variables: relative market share and the market growth rate. By combining these two variables into a matrix, a corporation can plot their business units accordingly and determine where to allocate extra (financial) resources, where to cash out and where to divest.
GE McKinsey Matrix
Then, the GE McKinsey Matrix was invented, which you can read more about here. To put it briefly:
It uses two variables: industry attractiveness and the competitive strength of a business unit. By combining these two variables into a matrix, a corporation can plot their business units accordingly and determine where to invest, where to hold their position, and where to harvest or divest.
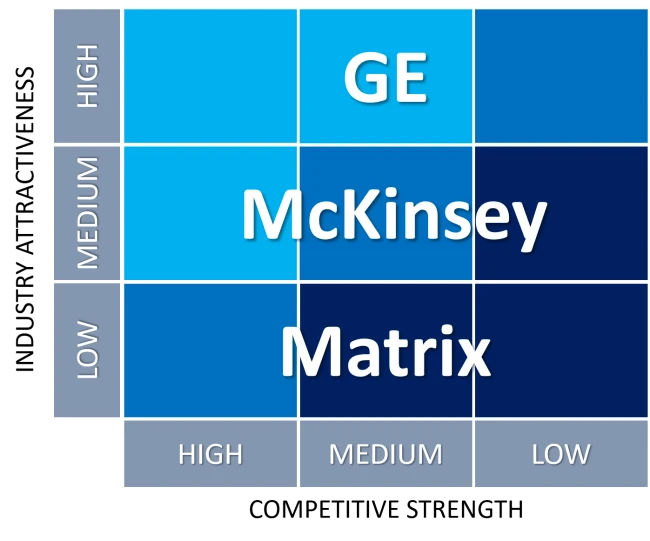
As per the blog post, the main difference between these comes from the fact that the latter uses multiple factors that are combined to determine the measure of the two variables: industry attractiveness and competitive strength. Whereas the BCG Matrix only uses 1 variable per axis — relative market share and market growth rate.
The GE McKinsey Matrix (also known as the Nine-box matrix) has industry attractiveness on the y-axis and competitive strength on the x-axis.
For industry attractiveness, factors to consider can be: Industry size; Long-run growth rate; Industry structure; Industry life cycle; Macro environment; and Market segmentation.
For competitive strength, factors to consider can be: Profitability; Market share; Business growth; Brand equity; Level of differentiation; Firm resources; Efficiency and effectiveness of internal linkages; and Customer loyalty.
How do you build your Matrix?
All the data will be hypothetical. The goal is to share the process and framework. Each company and market will have its own.
1. Define your factors
When we talk about market attractiveness, from your company’s perspective, what makes a market attractive? Consider all those factors and list them. Try to list all the factors that have a weight in that equation, but try to keep them under 10; otherwise, it’s too many to have to assess, and at some point, their weight into the attractiveness is negligible.
Now do the same for the factors that give your company a competitive advantage.
2. Weigh each factor
Not all factors are created equal. Some factors will influence whether a market is attractive or not. Similarly, for your competitive advantage, what factors give your company a bigger edge?
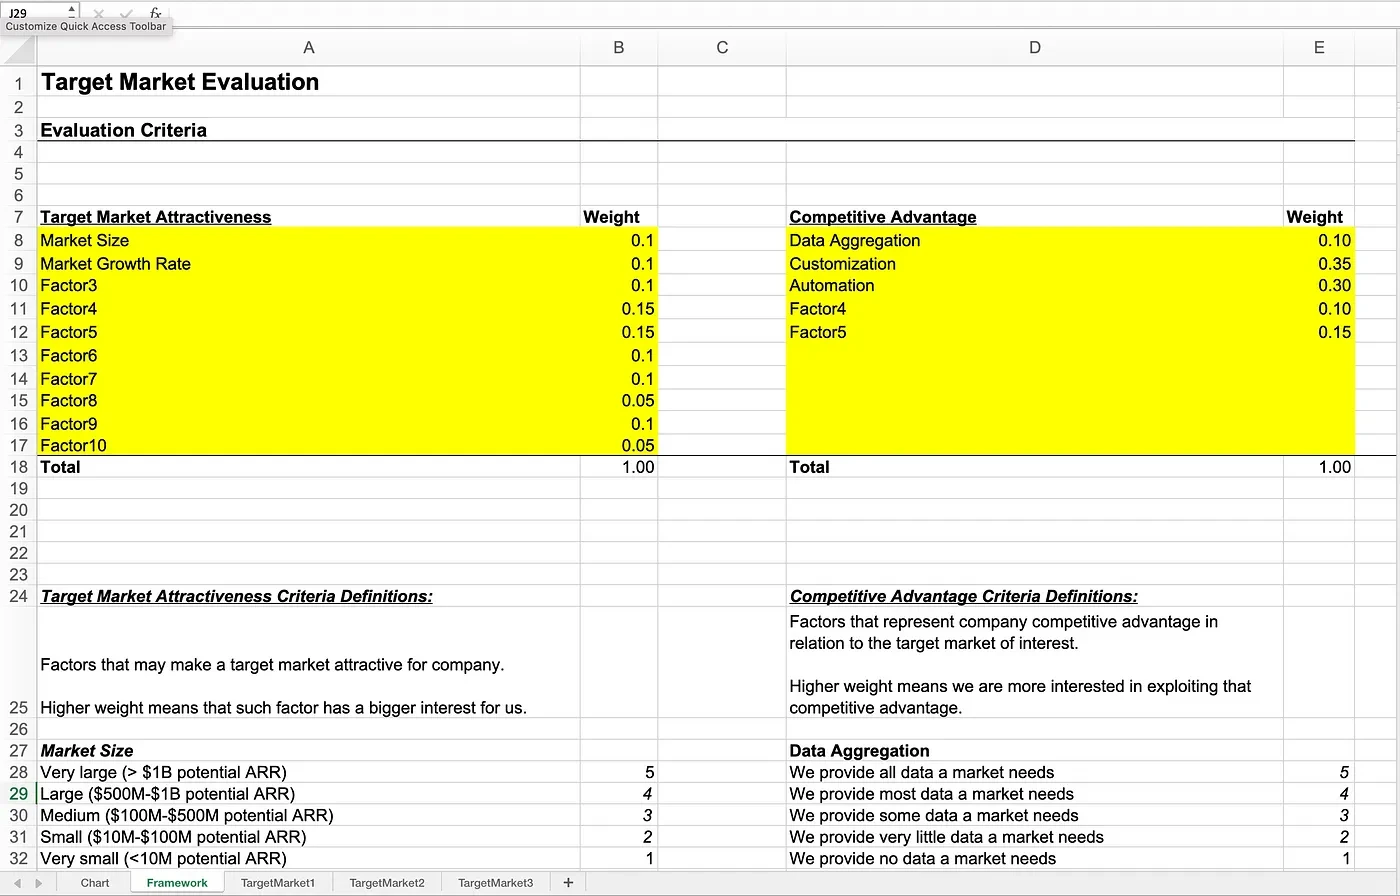
The goal is to select a weight for each factor so that the sum of the weights for all the factors adds up to 1. The outcome should look something like:

3. Categorize each factor
Now you need to decide how granular you want your assessment to be. Initially, at OpenBB, we started with a scale of 1–3 where 1 is low, 2 is medium, and 3 is high. However, soon we found this to not be good enough since there was not enough granularity. Thus, we increased the range from 1 to 5.
Once you decide on that range, you need to categorize it in a way that makes sense for each factor. This ensures that everyone on the team is on the same page when it comes to assessing a factor. For instance:
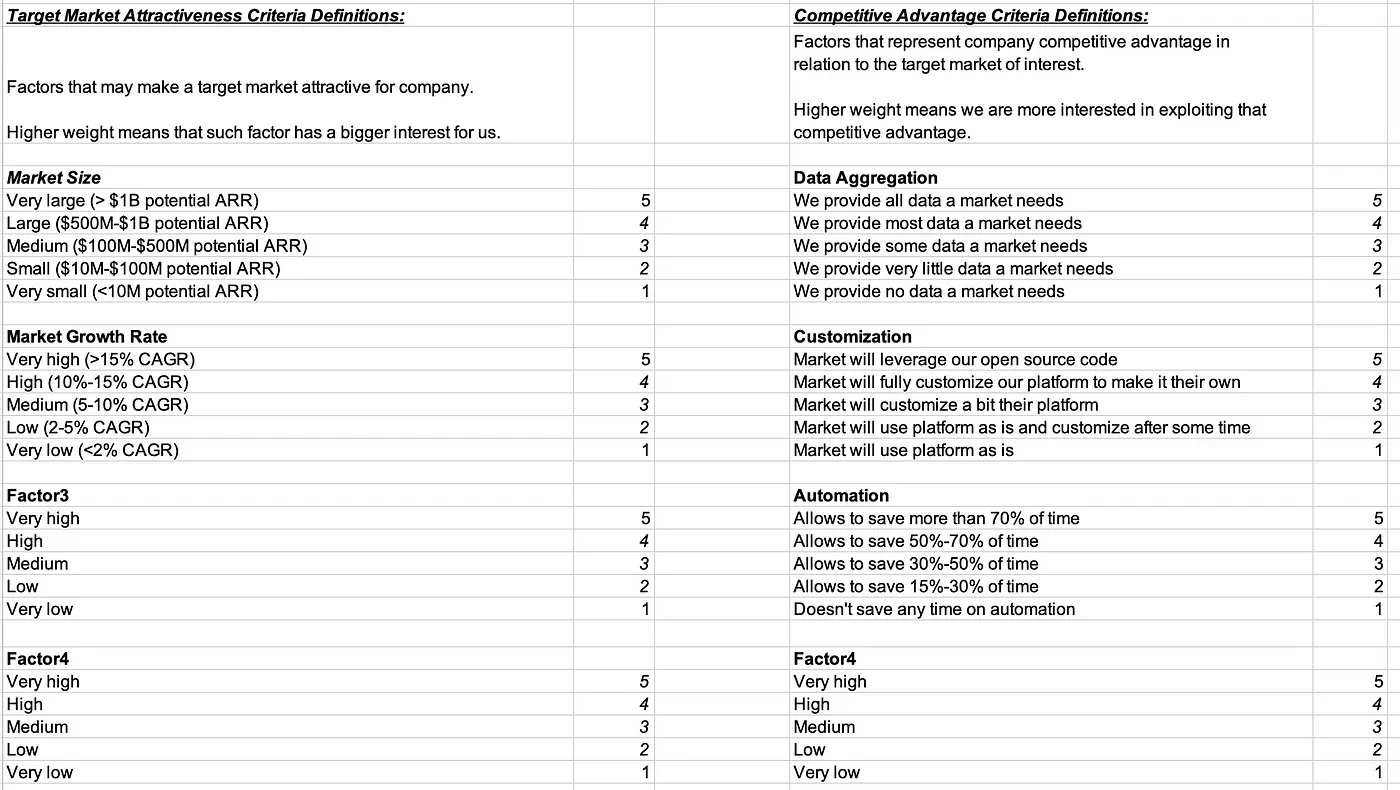
This Google / Excel spreadsheet should look like:
4. Select a list of target markets you want to evaluate
Create a new Google spreadsheet / Excel page for each of them. This will allow you to contain all details for each target market on the same page.
For the purposes of this demonstration, we will use “TargetMarket1,” “TargetMarket2,” and “TargetMarket3.”
5. Assess a target market based on selected factors
Now that we have decided on all the factors associated with the target market attractiveness, as well as the competitive advantage, you need to assess each of these based on the target markets that you have selected.
Each target market page should look something like this:
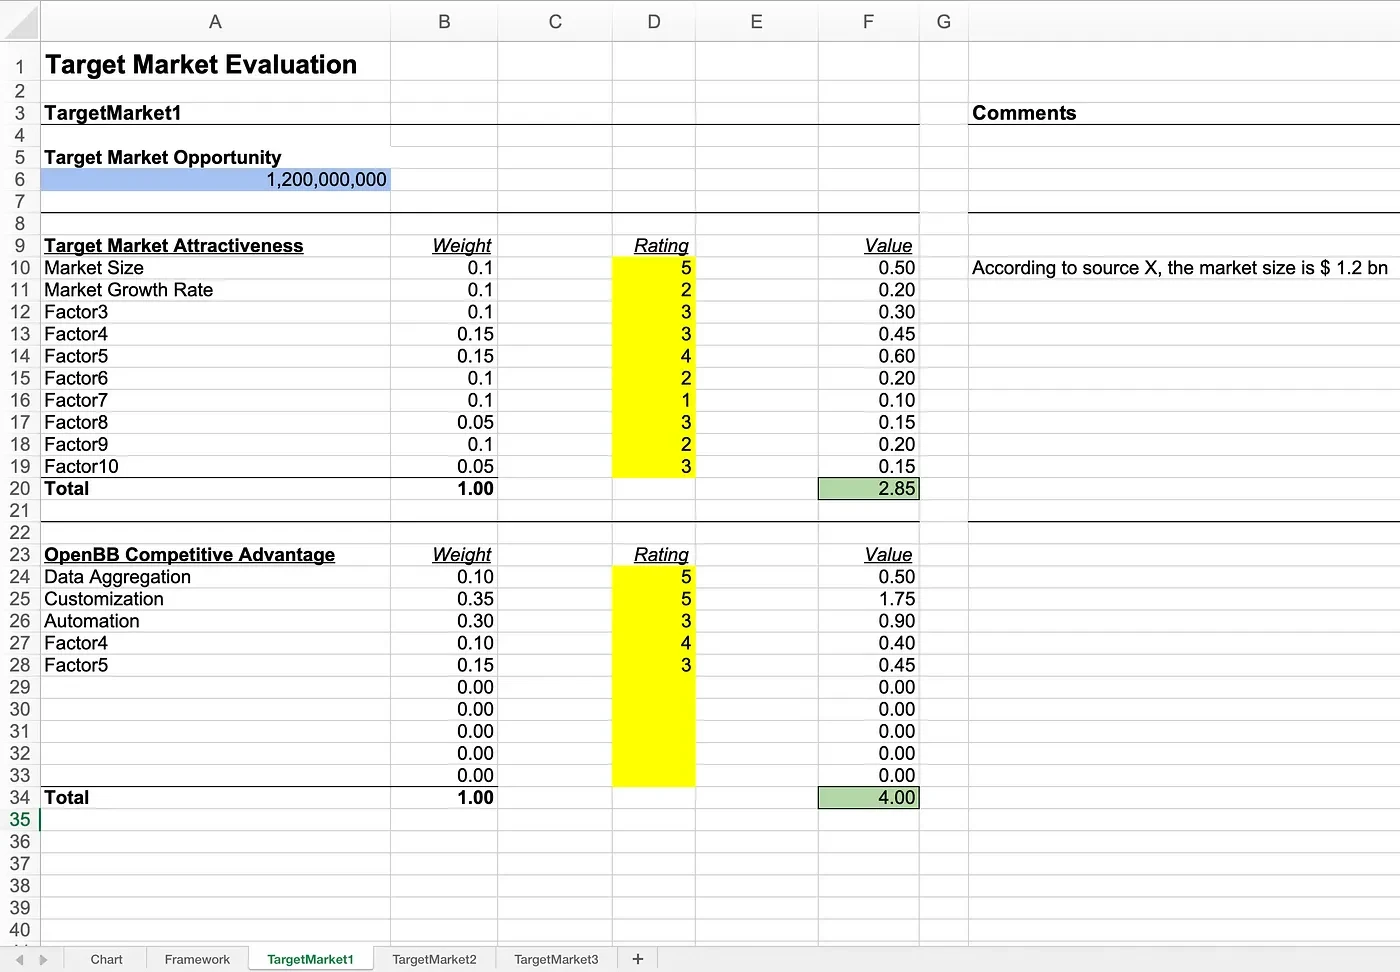
The factors and weights are automatically pulled from the “Framework page” built previously.
Here you just need to set the rating from 1 to 5 (or according to the range you previously specified) based on the evaluation criteria defined. Each of these ratings is multiplied by the weight, and all of those values are summed up together. If your selected range is from 1 to 5, then it means that the minimum and maximum values are 1 and 5, since the weights add up to 1.
Note that the last column allows you to add comments based on any additional information/criteria that you used to make a rating choice.
6. Discover Total Addressable Market
On the spreadsheet above, you may have seen the total addressable market value. I will address how to find this value in a subsequent post.
This is extremely important because even if the market is really attractive, its size can dictate whether to pursue it or not. Most of the time, you don’t want to be chasing a small market opportunity.
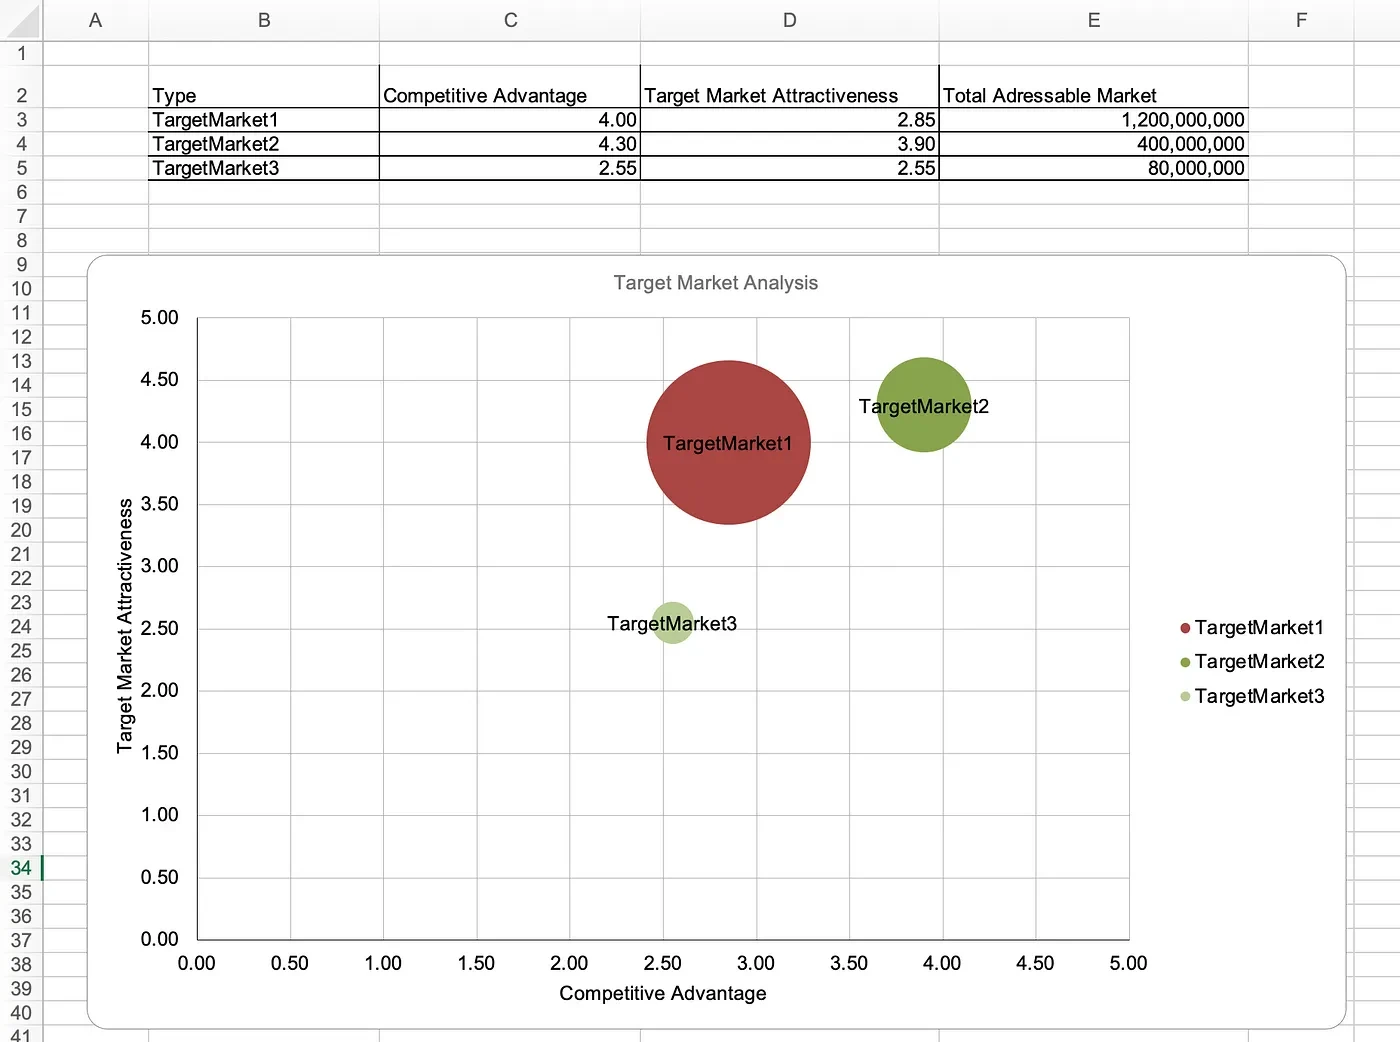
7. Final matrix / chart
Once you have all this data, you can build the following for each of the target markets:
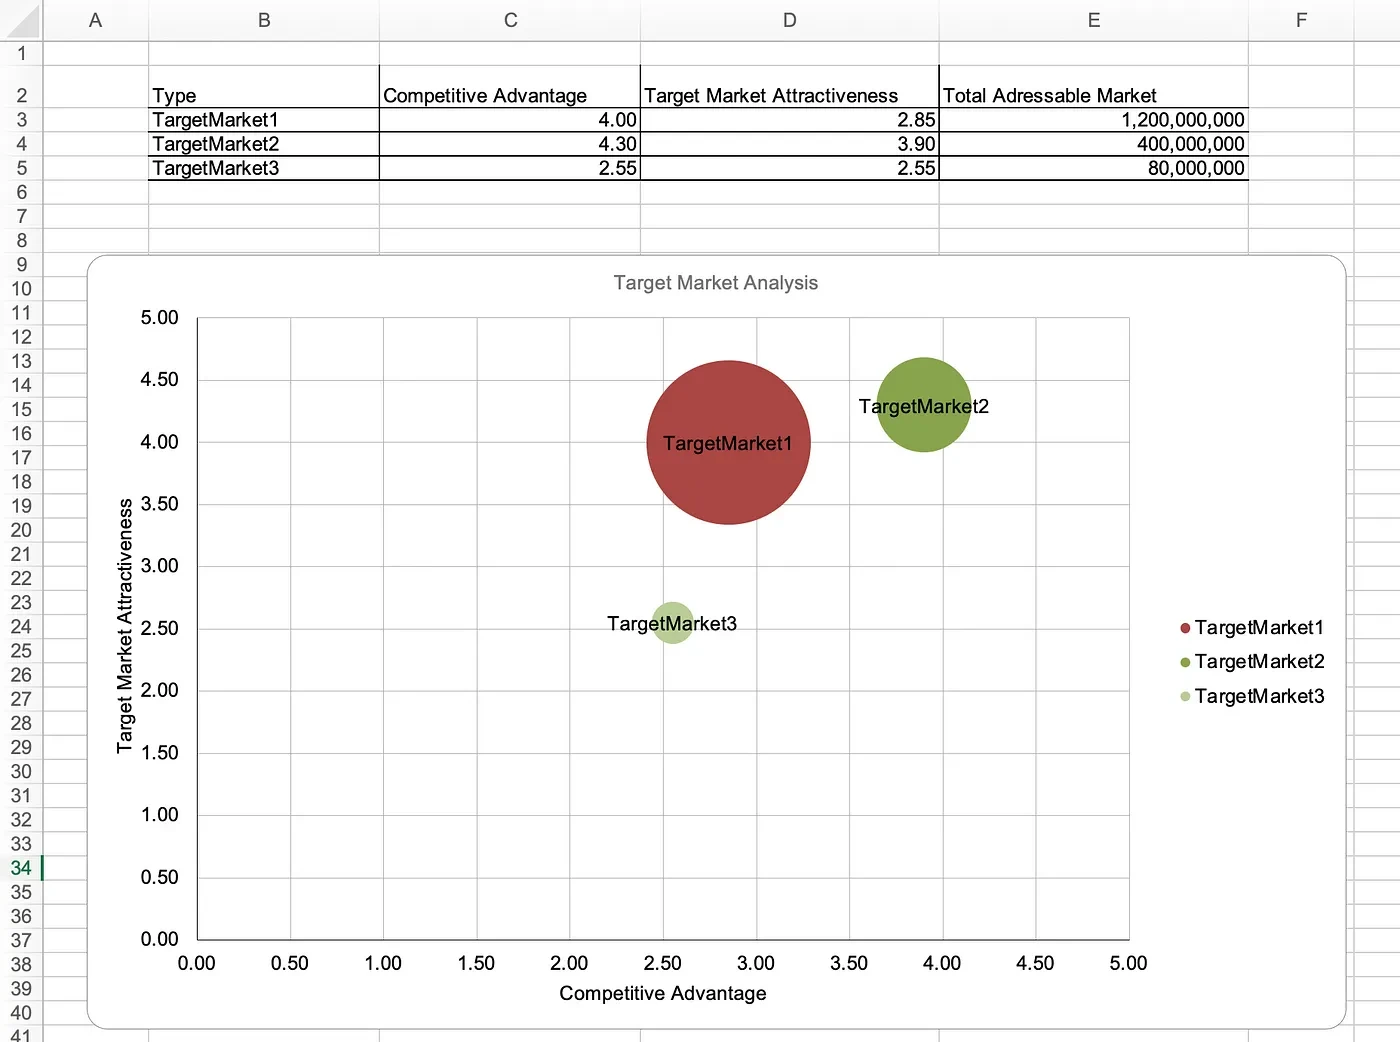
Note that all you need from each target market is:
Competitive advantage — the sum of all the factors and their levels multiplied by their weights gives the x-axis.
Target market attractiveness — the sum of all the factors and their levels multiplied by their weights gives the y-axis.
Total Addressable Market (TAM) — gives the bubble size on the chart.
Then you are ready to make a decision on which market you wish to pursue, and you have data to back it up.
Note: There are a lot of assumptions, and you’ll never have it perfect. But with several iterations with your team, you’ll gain more confidence in those assumptions over time, ensuring that you are on the right track and pursuing the right opportunity.
Using OpenAI to bounce ideas to assess a target market
Sometimes, it can be hard to provide a rating for each of the factors, or it would be better to bounce ideas off someone. This is where you can leverage OpenAI’s GPT-4 to help you get started.
I built a script that would read from an Excel spreadsheet all the information from the framework page that we have set. That basically means:
- All the factors associated with target market attractiveness, and their levels of description
- All the factors associated with competitive advantage, and their levels of description
Then I prompted GPT-4 to select a level for each of the factors of interest for both attractiveness and competitive advantage, based on what it knows about a specific target market.
For example, let’s say we want to assess the competitive advantage for the target market “Hedge Funds” — this is what the prompt looks like:
We want to assess our competitive advantage based in relation with factors where we are have an advantage.
Can you classify those for the following target market: 'Hedge Funds'
The factors that we will access this market are presented below:
When assessing Data Aggregation, these are the rules: We attribute a value of 5 if We provide all data a market needs We attribute a value of 4 if We provide most data a market needs We attribute a value of 3 if We provide some data a market needs We attribute a value of 2 if We provide very little data a market needs We attribute a value of 1 if We provide no data a market needs
When assessing Customization, these are the rules: We attribute a value of 5 if Market will leverage our open source code We attribute a value of 4 if Market will fully customize our platform to make it their own We attribute a value of 3 if Market will customize a bit their platform We attribute a value of 2 if Market will use platform as is and customize after some time We attribute a value of 1 if Market will use platform as is
When assessing Automation, these are the rules: We attribute a value of 5 if Allows to save more than 70% of time We attribute a value of 4 if Allows to save 50%-70% of time We attribute a value of 3 if Allows to save 30%-50% of time We attribute a value of 2 if Allows to save 15%-30% of time We attribute a value of 1 if Doesn't save any time on automation
When assessing Factor4, these are the rules: We attribute a value of 5 if Very high We attribute a value of 4 if High We attribute a value of 3 if Medium We attribute a value of 2 if Low We attribute a value of 1 if Very low
When assessing Factor5, these are the rules: We attribute a value of 5 if Very high We attribute a value of 4 if High We attribute a value of 3 if Medium We attribute a value of 2 if Low We attribute a value of 1 if Very low
Given this information, can you return a level for each of the factors that is our competitive advantage from a viewpoint of Hedge Funds target market.
Please return it in a json dictionary format with the factor and level only. Do not add any other text apart from that. Indent the json with 4 spaces.
Then, using the following block of code, we can get OpenAI’s GPT-4 to provide its input:
    response = openai.ChatCompletion.create(
      model="gpt-4",
      messages=[
            {
                "role": "system",
                 "content":
                    """
    You are an outstanding financial analyst and were given the task
    to perform market research on a possible market segment.
    The company succces relies on your accuracy to categorize a
    segment and classify according to the factors and levels specified.
                    """
            },
            {
                "role": "user",
                 "content": prompt
            },
        ]
    )
    print(response.choices[0].message.content)
This is what the output looks like:
    {
        "Data Aggregation": 3,
        "Customization": 4,
        "Automation": 5,
        "Factor4": 2,
        "Factor5": 3
    }
And that’s it for today.
All of this code is open source and available on my GitHub, here: https://github.com/DidierRLopes/target-market-analysis/tree/main
I hope you find this insightful, I appreciate any feedback as always.